Enhance Argo CD Observability: A Step-by-Step Guide to Integrating Prometheus Metrics into the UI
Bringing more observability to the Argo CD UI
In modern DevOps environments, monitoring and observability are crucial for ensuring the health and performance of applications. Argo CD, a popular GitOps tool, provides a streamlined approach to managing Kubernetes applications.
By integrating Prometheus metrics into the Argo CD UI, teams can track metrics such as resource usage, response times and error rates — all from within the Argo CD dashboard. This integration not only provides greater visibility into the health of your deployments, but also allows you to monitor them in real time.
In this guide, we’ll walk you through the steps to set up Prometheus metrics within the Argo CD UI. We’ll cover:
- Setting up Prometheus to collect metrics
- Setting up the Argo CD Metrics Server to connect Argo CD with Prometheus
- Configuring Argo CD to retrieve metrics from the Argo CD Metrics Server
By the end of this integration, you’ll have a robust monitoring system that provides key insights into your Kubernetes applications, improving your ability to manage and optimise deployments in real time.
Step 1: Setting up Prometheus (optional)
If you already have Prometheus installed you can skip this step. However, you may need to adjust the namespace, service name and port in step 2.
For everyone else, we will install the kube-prometheus-stack Helm Chart. Let's start by adding the required Helm Repository:
helm repo add prometheus-community https://prometheus-community.github.io/helm-charts
helm repo update
Next we install the Chart into the monitoring namespace:
helm install kube-prometheus-stack prometheus-community/kube-prometheus-stack --namespace=monitoring --create-namespace --waitOnce this step is complete, we can check the name and port of the Prometheus service:
kubectl get svc -n monitoring
NAME                                      TYPE        CLUSTER-IP       EXTERNAL-IP   PORT(S)                      AGE
alertmanager-operated                     ClusterIP   None             <none>        9093/TCP,9094/TCP,9094/UDP   655d
prometheus-kube-prometheus-alertmanager   ClusterIP   10.96.75.170     <none>        9093/TCP                     655d
prometheus-kube-prometheus-operator       ClusterIP   10.110.168.130   <none>        443/TCP                      655d
prometheus-kube-prometheus-prometheus     ClusterIP   10.101.130.20    <none>        9090/TCP                     655d
prometheus-kube-state-metrics             ClusterIP   10.101.150.66    <none>        8080/TCP                     655d
prometheus-operated                       ClusterIP   None             <none>        9090/TCP                     655d
prometheus-prometheus-node-exporter       ClusterIP   10.104.79.133    <none>        9100/TCP                     655d
We need the service called prometheus-operated, which uses port 9090.
Step 2: Setting up the Argo CD Metrics Server
The next step is to install the Argo CD Metrics Server, which will be connected to Prometheus and consumed by Argo CD. We start by adding the Helm Repository:
helm repo add christianhuth https://charts.christianhuth.de
helm repo update
Now we can install the Argo CD Metrics Server. By default the Chart is configured to reach the Prometheus service prometheus-operated.monitoring.svc:9090. If your setup is different, you can change the default configuration using the following values:
prometheus:
  # -- The namespace where Prometheus is running
  namespace: monitoring
  # -- The port on which the Prometheus service is listening for traffic
  port: 9090
  # -- The name of the Prometheus service
  service: prometheus-operated
If you have followed this guide, you can use the default configuration and continue with the installation:
helm install argocd-metrics-server christianhuth/argocd-metrics-server --namespace=argo --create-namespace --waitWithin the Argo CD Metrics Server you need to configure the metrics that will be displayed in the Argo CD UI and sent to Prometheus. In the default configuration, some metrics are already defined to be displayed on Pods, Deployments and Argo Rollouts. Please read the Helm Chart documentation if you want to customize the metrics: https://artifacthub.io/packages/helm/christianhuth/argocd-metrics-server
Step 3: Configuring Argo CD with the Metrics Extension
The final step is to configure Argo CD, which consists of three main settings:
- Download the Argo CD Metrics Extension, which adds the Metrics tab to the Argo CD UI
- Configure the Metrics Extension to connect to the Argo CD Metrics Server
- Enable some Argo CD features and settings required by the Metrics Extension
In the following, I assume that you are using the official Helm Chart to install Argo CD: https://artifacthub.io/packages/helm/argo/argo-cd.
Step 3a: Download the Argo CD Metrics Extension
The Metrics Extension can be downloaded and included in the Argo CD Server with the following values:
server:
  extensions:
    enabled: true
    extensionList:
      - name: extension-metrics
        env:
          - name: EXTENSION_URL
            value: https://github.com/argoproj-labs/argocd-extension-metrics/releases/download/v1.0.3/extension.tar.gz
          - name: EXTENSION_CHECKSUM_URL
            value: https://github.com/argoproj-labs/argocd-extension-metrics/releases/download/v1.0.3/extension_checksums.txt
Please be sure to add the latest version of the Metrics Extension as you read this guide: https://github.com/argoproj-labs/argocd-extension-metrics/releases.
Step 3b: Configure the Argo CD Metrics Extension
With these values we configure the Argo CD Metrics Extension to connect to the Argo CD Metrics Server we installed in step 2:
configs:
  cm:
    extension.config: |
      extensions:
        - name: metrics
          backend:
            services:
              - url: http://argocd-metrics-server.argo.svc:9003
If you used a different release name and/or namespace when installing the Argo CD Metrics Server in step 2, you will need to adjust this URL to match your setup.
Step 3c: Enable some Argo CD features and settings
The last step is to enable an alpha feature of Argo CD called Proxy Extension. See the documentation for more information on this feature. We also need to define permissions to access the metrics in the UI using RBAC. If you want to customize the RBAC settings, please refer to the official Argo CD documentation.
  configs:
    params:
      server.enable.proxy.extension: true
    rbac:
      policy.csv: |-
        p, role:readonly, extensions, invoke, metrics, allow
Conclusion
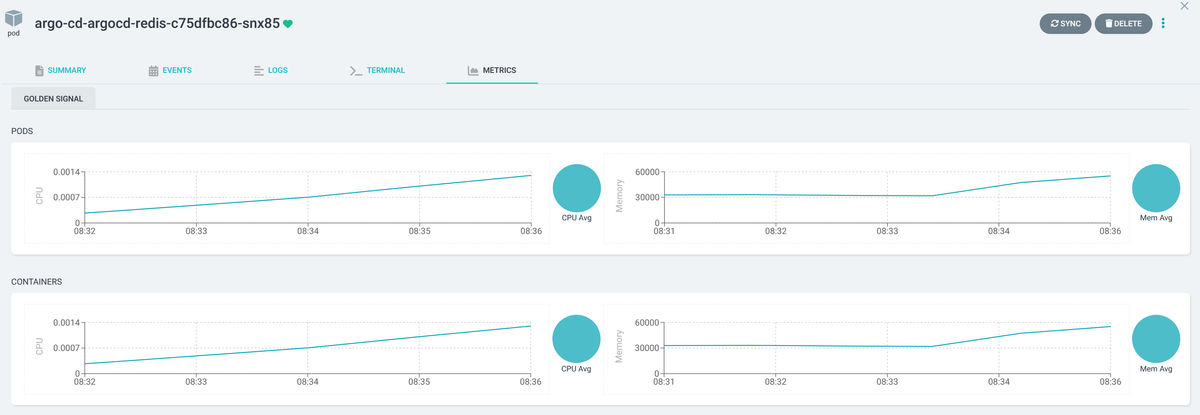
By following this guide, you will have integrated Prometheus Metrics into the Argo CD UI in less than 15 minutes. This gives your users a single place to get insight into their applications.
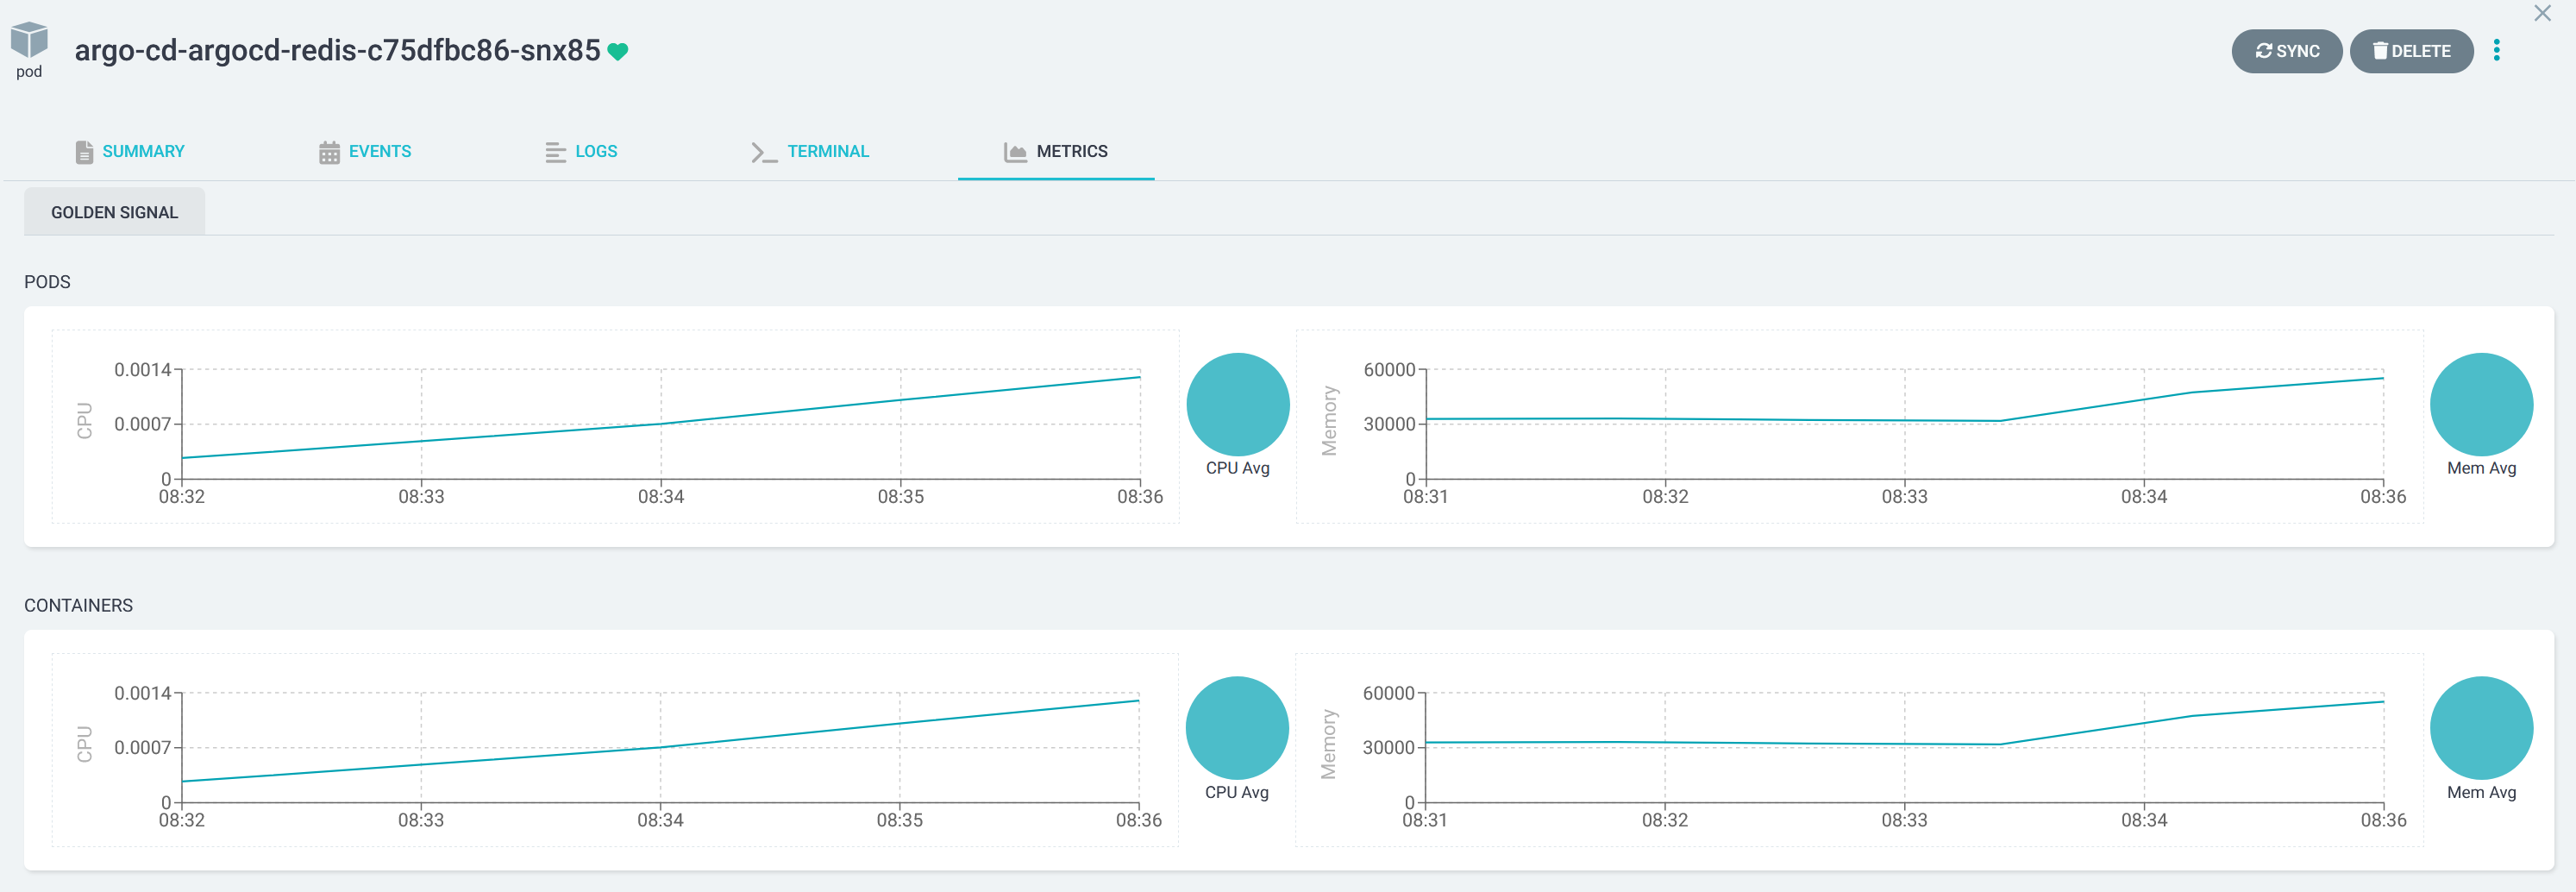
I have also created a minikube demo project that demonstrates this integration. Check it out on GitHub and give it a try before integrating it into your live environments.
 christianhuth