Exposing Linux User and Group information with the Prometheus Textfile Collector
Learn how to set up the Textfile Collector to expose Linux user and group data as Prometheus metrics.

In this article, I’ll show you how to set up the Textfile Collector to expose Linux user and group data as Prometheus metrics, allowing you to seamlessly integrate this insight into your existing monitoring dashboards. Whether you're managing a small setup or a large infrastructure, this approach provides a simple yet effective way to keep track of user access and permissions across your systems.
Textfile Collector
The Prometheus Textfile Collector is a powerful tool that allows you to generate custom metrics by exposing information through simple text files. For Linux administrators, using this feature to track and monitor system information — such as users and groups — can provide valuable insight into system access and configuration changes over time.
Overview
The setup includes the following parts:
- Scripts that extract the user and group data
- CronJob that periodically executes these scripts and writes the output to a text file
- Prometheus Node Exporter, which collects these text files
Step 1: Prometheus installation
Let's start by installing Prometheus and the Prometheus Nodes Exporter using the kube-prometheus-stack Helm Chart. First we need to add the Helm Repository:
helm repo add prometheus-community https://prometheus-community.github.io/helm-charts
helm repo update
Next, we need to set up the configuration for the Helm Chart. We need to make sure that the Textfile Collector is enabled, which is done by adding the flag --collector.textfile.directory as an argument to the Prometheus Node Exporter. Your configuration might look like this:
prometheus-node-exporter:
  extraArgs:
    # kube-prometheus-stack chart's default configuration
    - --collector.filesystem.mount-points-exclude=^/(dev|proc|sys|var/lib/docker/.+|var/lib/kubelet/.+)($|/)
    - --collector.filesystem.fs-types-exclude=^(autofs|binfmt_misc|bpf|cgroup2?|configfs|debugfs|devpts|devtmpfs|fusectl|hugetlbfs|iso9660|mqueue|nsfs|overlay|proc|procfs|pstore|rpc_pipefs|securityfs|selinuxfs|squashfs|sysfs|tracefs)$
    # enable textfile collector
    - --collector.textfile.directory=/host/root/var/lib/prometheus-node-exporter/textfile-collector/metrics
values.yaml
Now, we can install the Helm Chart with this configuration:
helm upgrade --install kube-prometheus-stack --namespace monitoring --create-namespace \
-f values.yaml --wait prometheus-community/kube-prometheus-stack
Step 2: Define scripts to extract data
Now we can write scripts to extract the necessary information. On Linux systems, all the information we want to expose is stored in the files /etc/passwd and /etc/group:
/etc/passwdcontains information about users such as their username, userid or their home directory/etc/groupcontains information about groups, such as the group name, groupid and users in that group
Step 2a: Extract user information
The /etc/passwd file looks something like this:
root:x:0:0:root:/root:/bin/bash
daemon:x:1:1:daemon:/usr/sbin:/usr/sbin/nologin
bin:x:2:2:bin:/bin:/usr/sbin/nologin
sys:x:3:3:sys:/dev:/usr/sbin/nologin
sync:x:4:65534:sync:/bin:/bin/sync
games:x:5:60:games:/usr/games:/usr/sbin/nologin
man:x:6:12:man:/var/cache/man:/usr/sbin/nologin
lp:x:7:7:lp:/var/spool/lpd:/usr/sbin/nologin
/etc/passwd
Each row contains information about a single user, with each column separated by a :. The columns are from left to right: username, password, user id, primary group id, gecos info, home directory and shell. If you want to learn more about this file, check out this link.
With this in mind, we can create a script that reads each single line and outputs a metric, which I will call linux_user_info. This metric will contain the username, user id, primary group id, home directory and shell of each user. The script is quite simple:
#!/bin/bash

set -eo pipefail

while IFS=':' read -r username encryptedPasswordInShadowFile userId groupId userIdInfo homeDirectory shell; do
    echo "linux_user_info{username=\"$username\",uid=\"$userId\",gid=\"$groupId\",home=\"$homeDirectory\",shell=\"$shell\"} 1"
done < "/etc/passwd"
Step 2b: Extract group information
The /etc/group file looks something like this:
root:x:0:
daemon:x:1:
bin:x:2:
sys:x:3:
adm:x:4:syslog,daemon
tty:x:5:syslog
disk:x:6:
lp:x:7:
/etc/group
Each row contains information about a single group, with each column separated by a :. The columns are, from left to right, group name, password, group id and a list of users in that group. If you want to learn more about this file, see this link.
The corresponding script reads each line and outputs a metric which I will call linux_group_info. This metric will contain the group name, group id and the list of users in each group. The script looks very similar to the previous one:
#!/bin/bash

set -eo pipefail

while IFS=':' read -r groupname password groupId users; do
    echo "linux_group_info{groupname=\"$groupname\",gid=\"$groupId\",users=\"${users%,}\"} 1"
done < "/etc/group"
Step 2c: Extract group membership
Finally, we want to extract the members of each group and create a metric for this information. Again, we will use the /etc/group file, which already contains the information we need, but in comma-separated form. Our script needs to iterate over each entry in the /etc/group file, split the users, and create a metric for each user in that list. A sample script might look like this:
#!/bin/bash

set -eo pipefail

while IFS=':' read -r groupname password groupId users; do
    if [ ! -z "${users}" ];
    then
        IFS=',' read -r -a array <<< "$users"
        for element in "${array[@]}"
        do
            echo "linux_group_membership{groupname=\"$groupname\",gid=\"$groupId\",username=\"${element}\"} 1"
        done
    fi
done < "/etc/group"
Step 3: Set up the CronJob
The last step is to glue everything together and set up a cronjob to periodically update the metrics with the latest values.
- Move the scripts to the node (e.g. to
/var/lib/prometheus-node-exporter/textfile-collector/scripts) - Create the empty metrics files (
*.prom) that will contain the script output (e.g. in/var/lib/prometheus-node-exporter/textfile-collector/metrics) - Make sure sponge is installed on the node (comes from the
moreutilspackage) - Create cronjobs that run the scripts and pipe the output to the metrics files
An example of a CronJob looks like this:
*/1 * * * * root /var/lib/prometheus-node-exporter/textfile-collector/scripts/linux-user-info.sh | sponge /var/lib/prometheus-node-exporter/textfile-collector/metrics/linux_user_info.prom > /dev/nulllinux_user_info
*/1 * * * * root /var/lib/prometheus-node-exporter/textfile-collector/scripts/linux-group-info.sh | sponge /var/lib/prometheus-node-exporter/textfile-collector/metrics/linux_group_info.prom > /dev/nulllinux_group_info
*/1 * * * * root /var/lib/prometheus-node-exporter/textfile-collector/scripts/linux-group-membership.sh | sponge /var/lib/prometheus-node-exporter/textfile-collector/metrics/linux_group_membership.prom > /dev/nulllinux_group_membership
These examples will run the scripts every minute and pipe their output to the appropriate metrics file. Simply add these files to the /etc/cron.d directory. They must be owned by root.
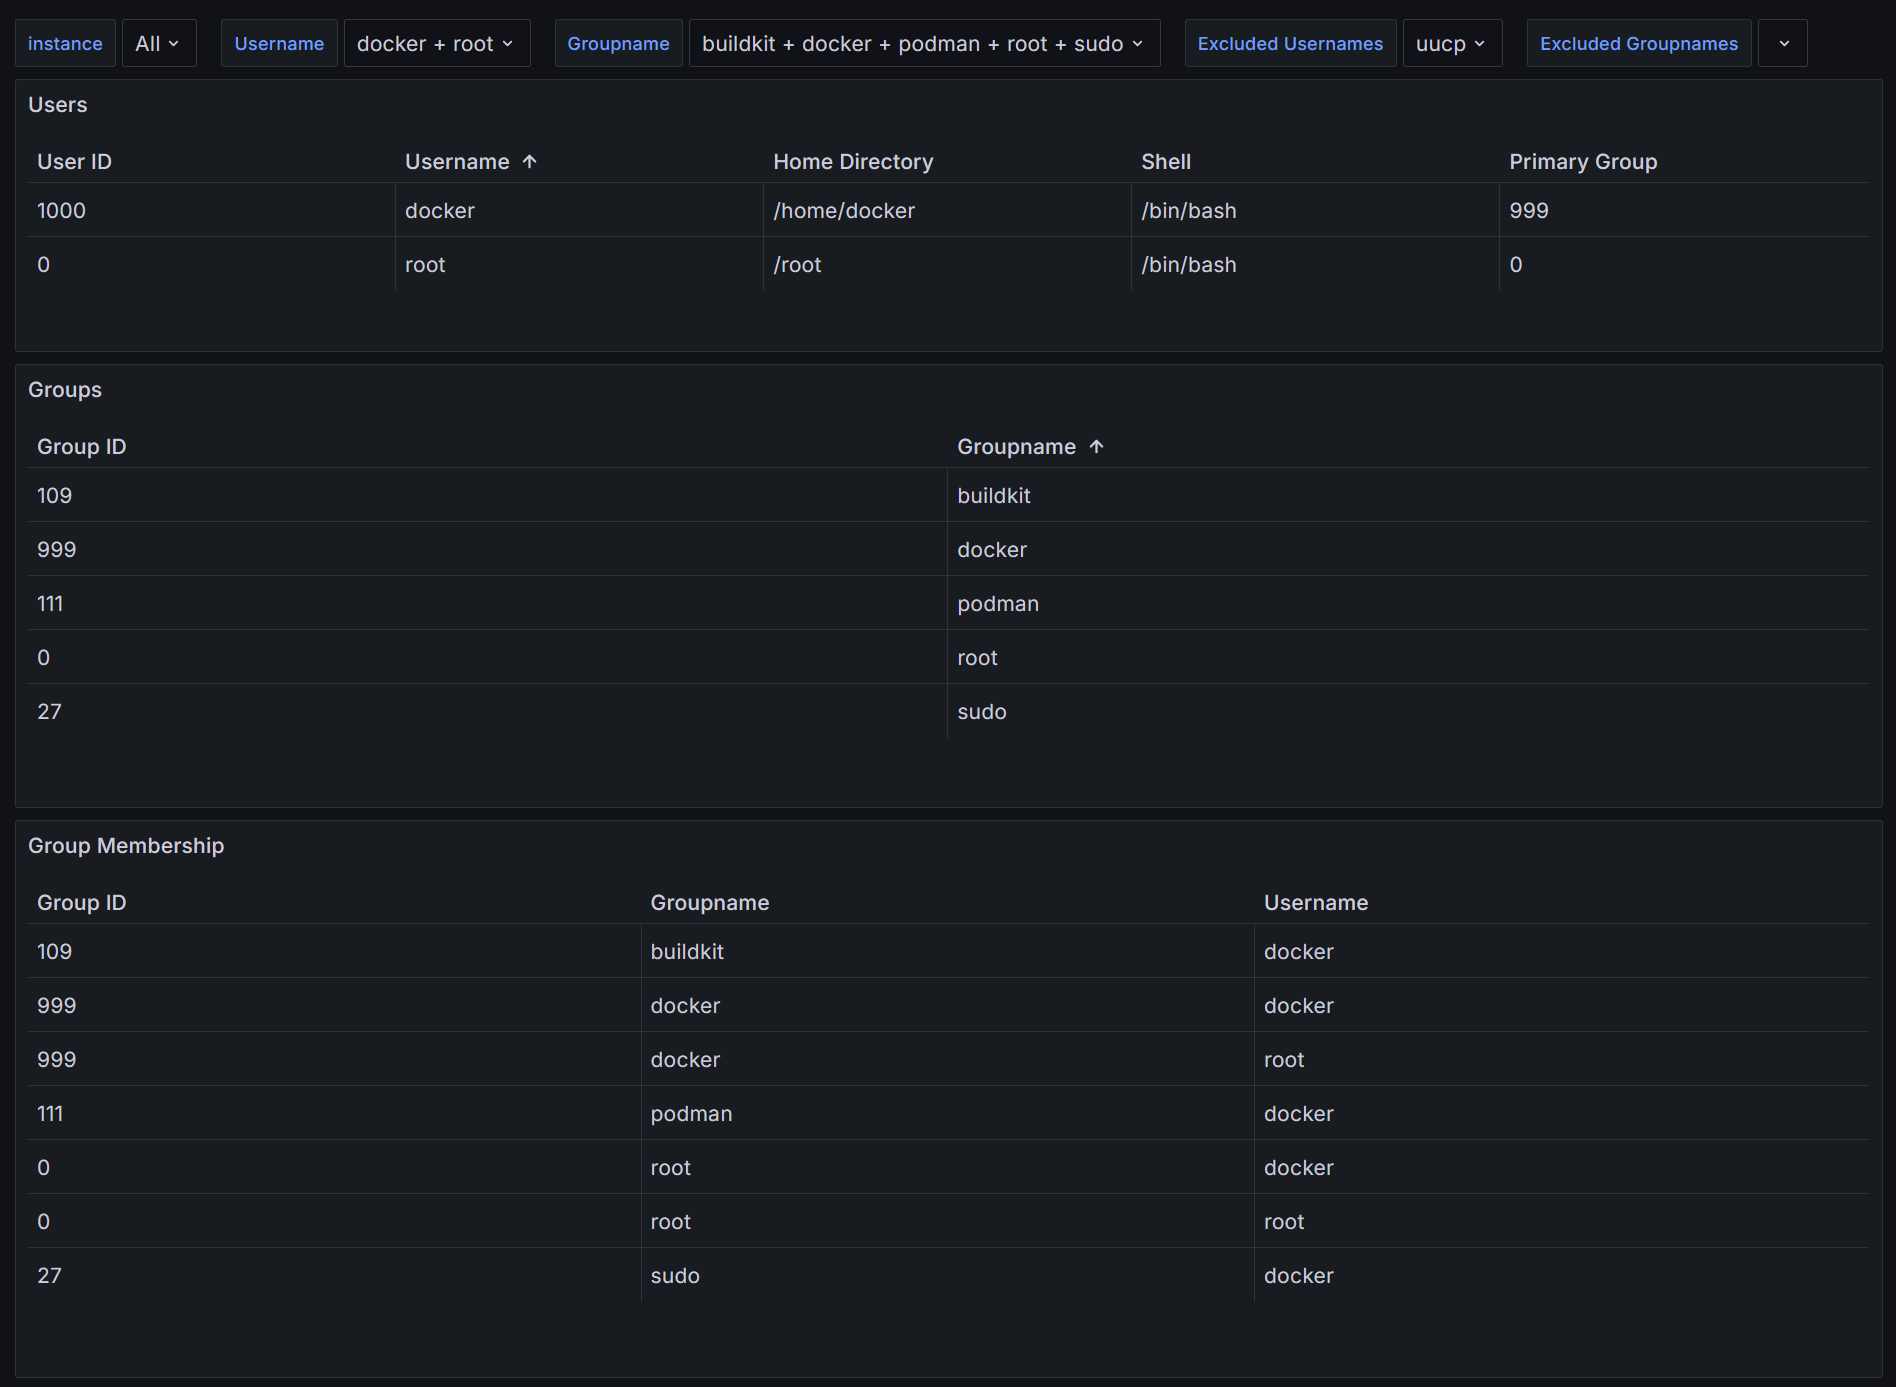
Once the cronjobs are running, you should be able to see your metrics in Prometheus and display them in Grafana. Here is a simple dashboard showing the metrics:

Conclusion
Prometheus' Textfile Collector of is a powerful feature to collect information from a Kubernetes node that is not included in the Node Exporter and display it as a normal Prometheus metric.
The possibilities are endless and only limited by your imagination. There is a GitHub repository that contains many scripts that can be used in conjunction with the Textfile Collector. Check it out for inspiration:
I'd love to hear about the problems you've solved using the Textfile Collector in the comments. You can try this approach in a demo environment I published on GitHub. Check out the link in the Resources section.
Resources
- Node Exporter GitHub Repository: https://github.com/prometheus/node_exporter#textfile-collector
- Collection of Scripts for the Textfile Collector: https://github.com/prometheus-community/node-exporter-textfile-collector-scripts
- Demo project including the Grafana Dashboard: https://github.com/christianhuth/minikube/tree/main/linux-user-and-group-monitoring-with-prometheus-textfile-collector


